Tech
Hardware or software. Invention or innovation. If someone’s pushing technology forward, you’ll find it here.
Follow
9 followers
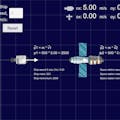
Interactive STEM experiments
Interactive experiments on Physics and Math for K-12 program

Sage Project
Beautiful visualization of nutritional facts 🍟🍉🌮

City Roads
Open source, visualization of all roads within any city.
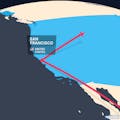

The Visualization Universe
Catalog of all chart types and tools to build them



Knowledge is Beautiful
Taking infographics & data-visualisation next level (book)


Autonomous Visualization System
Make a leap with your autonomous and robotics data
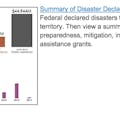
FEMA Data Vizualization
See the disaster history of your state.

MatrixEase
An visualization and analysis tool for large matrix data


